Improving Frontend User Experience with Profiling and Performance
User interfaces that load rapidly and accurately make users happy and score better in search engines. This article recalls basic foundations of good web application performance, and offers insights from a case study based on Process Analytics BPMN Visualization library.
by Marcin Michniewicz, Bonitasoft R&D Engineer
Developers know that applications that are quick to respond, with user interfaces that load rapidly and accurately, make users happy and willing to use your work. Pages that conform to good UI UX principles score better in the search engines. Unresponsive applications and long executions can cost you a lot.
This article will describe some of the basic foundations of good web application performance, and then I’ll offer some insights taken from a case study based on Process Analytics BPMN Visualization library.
(NOTE: If you wish to skip the theoretical part you can go directly to the chapter: Profiling and Performance improvement.)
Web App Performance — overview
From HTML, CSS, JS to the visible result
The following section will briefly explain what happens under the hood of the browser after fetching the source files from the web address.
The time needed for a page to load is critical for a good user experience. This time depends on many factors, like the networking speed, chosen browser, and the PC resources. All major actors: Chrome, Safari, Firefox, Edge (the list goes on) are constantly improving their software to give us a better experience: speed and security are at stake here. Let’s assume that browsers respect the specifications, and the networking and computational power are excellent. What will then have an impact on the user experience?
The browser goes through the following steps to produce what we see on the screen:

Briefly, a user like me or you types the page address in the url, and the story begins. The browser fetches the files and starts its interpretation.
The first step is to parse the HTML into a Document Object Model (DOM), an object-oriented representation of the web page.
Then, a CSS Object Model (CSSOM) is created from all declared CSS rules (inline, internal and external).
Next step is the creation of the Render Tree, which is a combination of the two steps described before. We can say that it is a low level representation of what finally will be printed on the screen.
When the Render Tree is ready, the Layout calculation can begin. In this step each element (node) of the Render Tree will get its position and size calculated (the browser now knows where to print them on the screen).
The next step, Painting, can then be processed. The browser creates layers, so it can handle the overlapping elements or animations and changes in the look of these elements. Each layer is rasterized (drawn pixel by pixel) separately, to be finally processed in the step called Compositing, where all layers are finally drawn on the screen.
If you’d like more information, there is a very good article describing this process in detail, How the browser renders a web page? — DOM, CSSOM, and Rendering by Uday Hiwarale.
JavaScript?
Hmm… exactly where is JavaScript in this process?
We are almost there, grab a coffee and carefully read what is written next :-).
Each time a script element appears in the HTML being parsed, the DOM creation is paused while the script is loaded.
If the element is an embedded script, it is executed right away, and DOM parsing continues only after execution.
For external elements, there is also a pause in DOM parsing while the script is being downloaded. When the script is marked as async, parsing is continuing while the file is being downloaded and halted just after the download completed, and the file is being executed.
So DOM parsing is halted either while the script is downloaded or when the script is executed. The ‘defer’ keyword comes to the rescue here, as the scripts with the defer attribute do not block the DOM parsing process. The deferred scripts are executed only after the DOM tree is fully constructed.
TIP: Remember that load time of the script impacts the page readiness — make sure the script size is optimal and use defer or async attributes whenever possible. This will help to reduce the impact on blocking the DOM parsing.
Let’s dig further
The crucial part of the JavaScript code performance is the execution time of the scripts.
When writing code we focus on its quality, testability, and readability. The very important thing that must not be forgotten is the speed of the execution: single statements, functions and finally functionality as a whole. Performant code helps to achieve the best user experience.
Ready for more?
JavaScript execution performance
Let’s put some light on the V8 engine — the runtime environment where the JavaScript code is executed.
Engine
There are many engines out there, to name a few:
- V8 : Chrome, Microsoft Edge, Opera (NodeJS is also using it as well as Electron)
- SpiderMonkey : Firefox
- JavaScriptCore : Safari
I will focus on V8 in this section, but the basic principles are consistent among all engines. V8 is Google’s open source high-performance JavaScript and WebAssembly engine, written in C++. How does it work?
The road to machine code
What happens with your source code? Three important steps to know:
- AST — the abstract syntax tree is generated from code by the parser.
- The interpreter generates bytecode from the syntax tree.
- The compiler generates machine code.
The optimization at engine level is a very complex process, and is more in the interest of the engine engineers. However, the V8 blog post Firing up the Ignition interpreter can give you more information on this.
Stay on the performant path
Here is a good reference to read more in detail: How JavaScript works: Optimizing the V8 compiler for efficiency, by Alvin Wan.
Some of the mentioned tips are:
- Declare object properties in constructor
- Keep object property ordering constant
- Fix function argument types
- Declare classes in script scope
Lighthouse — auditing
General page performance and quality can be audited with Lighthouse, a good open source tool. It performs audits for performance, accessibility, progressive web apps, SEO and more. If you feel something is not correct or just want to check your page, launch the tool and in almost no time you will have good audit results.
Profiling and Performance improvement
To briefly summarize the previous chapter: well-performing applications make users happy and willing to use your tool. Pages that conform to good UI UX principles score better in search engines. Remember to optimize the load time of your page as well as the code execution times. Unresponsive applications and long executions can cost you.
Now let’s look at ways to improve an application.
Each time we progress with a new project we learn new things. Initially we write the code the way it works. Then, we write the code that works, is maintainable, and is well tested. Finally, we make sure that it is performant, non-blocking. We make sure that user experience is flawless.
There’s always some moment during the project development where you feel that something just isn’t right. The app is running well but in the back of your mind you feel that some parts can be done better, perform quicker. It’s always a good idea to use available measures and get an objective view on your application’s performance.
Profiling to improve — If you can measure it, you can optimize it!
Let’s see the profiling tool on a case study.
TIP: I chose a complex BPMN model for an example as this gives a better view on the subject. With smaller models the gain is less obvious.
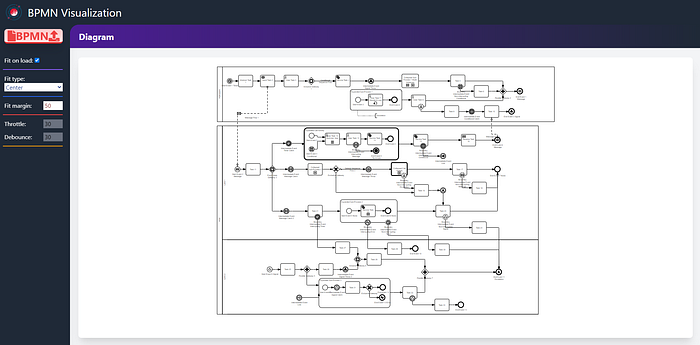
>During the work on Process Analytic tools, we saw that the navigation mechanism wasn’t as fast as we wanted. To validate the subjective impression, I decided to use the Google Chrome Dev Tools Profiler. This built-in tool is very powerful and offers vast capabilities. Below I’ll show you the profiling done on the diagram zoom feature.
Performance Tab
The Performance Tab records the user actions’ causing code execution times, and displays resulting metrics as flame charts. Below we can see the recording from 3 zooming actions. The quicker the mouse wheel turns, the more times functions are invoked.
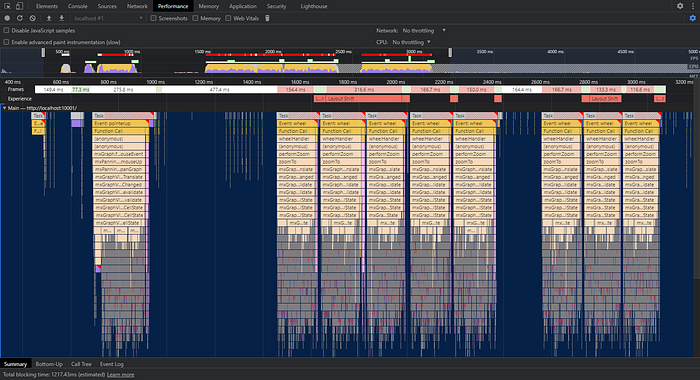
To see what’s making the execution long, we’ll pick a single Task execution. The highlighted performZoom is the script we are interested in.

Diving further into details…
OK, we can see that there are multiple mxCellRenderer.redraw function calls run sequentially.
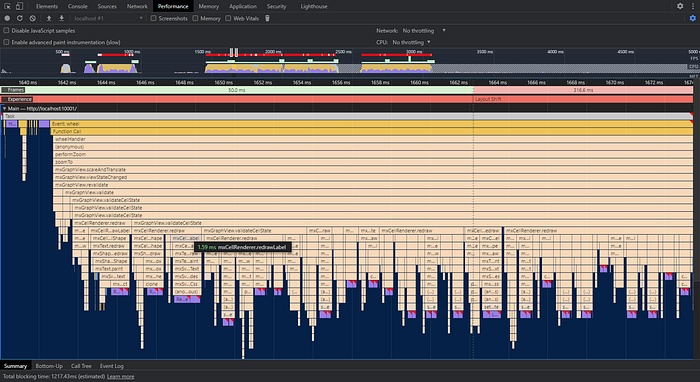
Let’s zoom further…
The Profiler gives us a hint — Recalculate Style: Forced reflow is a likely performance bottleneck.
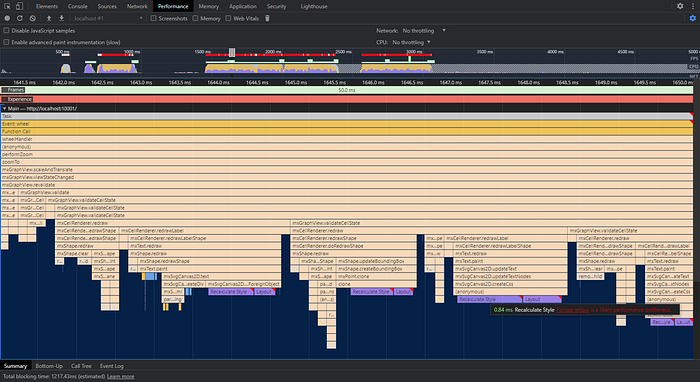
Since Style Recalculation happens sequentially, and each cell in the diagram is handled this way, it really causes excessive computations.
What can we do about that? The problem lies in the underlying library. The ideal solution would be to check why was it implemented this way and weigh the advantages / disadvantages of rewriting the code. The underlying mxGraph library is Open Source, so this is possible, however lack of testing complicates things as we might introduce regression. Unfortunately not really much can be done here. Wait…what about throttling?
We are handling events, and we can see on the flame charts that the total execution time is equal to the sum of times of all executions. Perhaps reducing the number of executions can be a way to go? Debounce and throttle are two techniques to control how many times we allow a function to be executed over time. The complete explanation of how these mechanisms work is here.
By using throttle , we prevent the function from executing more than once every X milliseconds. Debounce permits grouping multiple function calls into one single call.
Let’s first check how the situation looks without throttling / debounce. The following image with its console log should help clarify the mechanism. Here mouse-wheel movement resulted in 4 calls / executions, with a blocking time ~589 ms.

Now let’s see results when we apply throttling (to zoom factor calculations) and debounce (to group all actual scaling calls in to the one at the end). There are more zoom factor calculations than before (7 times vs 4 is due to the faster mouse-wheel move), but the actual scaling happens only once: blocking time ~129 ms. What a GAIN!
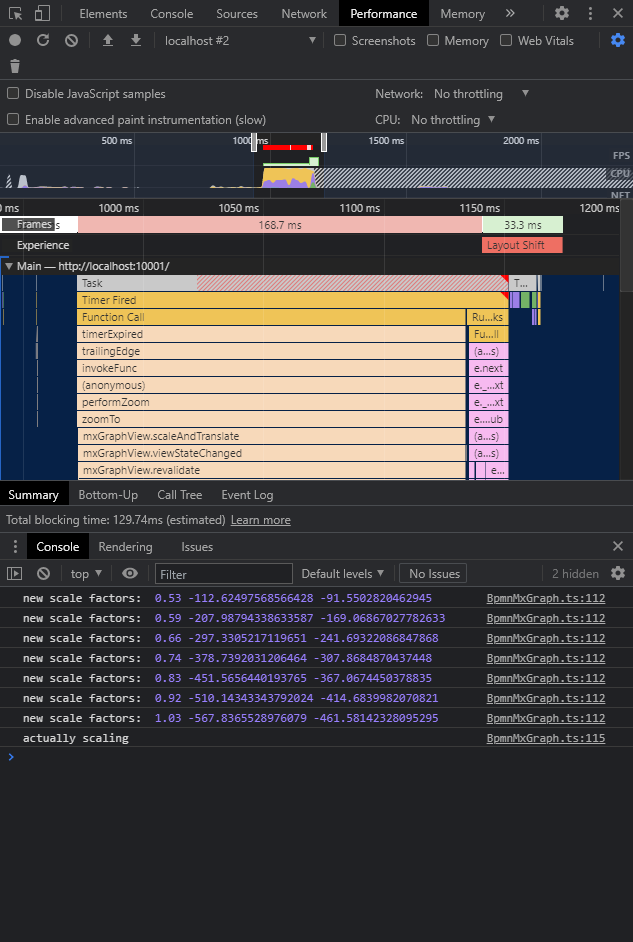
OK, but does this gain really reflect the user experience? I have checked manually, and it was obviously better. But I still felt that improvements can be made. As debounce and throttle are configurable I can still play with different values. Chrome Dev Tools offers another useful tool: FPS Meter.
FPS Meter
While playing with the different parameters for debounce and throttle I saw the following results. You can see the tool on the top left corner in the following images.
First test, no throttling / debounce: only 11 FPS.

Second test, throttling: 10 / debounce: 100. 18 FPS.

Third test, throttling: 50 / debounce: 100. 21 FPS.

Fourth test, throttling: 30 / debounce: 40. 21.6 FPS.

Below, just for the comparison, navigation with a smaller diagram.
No throttling / debounce: 40.2 FPS.

With throttling / debounce: 47.4 FPS.
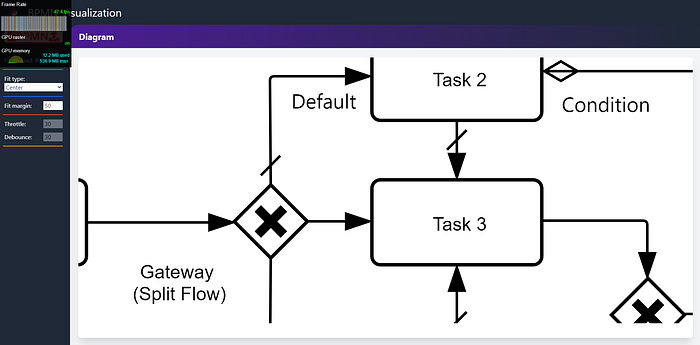
It looks very good!
Automation everywhere
I wanted to put in place a sort of automated version of the previous profiling. It does not include everything yet, but a significant part was put in place. With these tests we can check if some newly introduced code is not compromising the existing performance.
NOTE: Although they are not in the scope of this article, the implementations of the Performance Tests in Process Analytics bpmn-visualization library are here: doc & code.
I used amCharts for visualization.
Below you can see 2 useful charts: Zoom Performance and Load Performance. In this article I’ve described the zoom performance, and its improvement. Since it is crucial for us that we load BPMN diagrams with good speed, we decided to put the load performance under tests and observe the changes periodically when new functionality arrives. It is completely normal that the throttle and debounce mechanisms introduced in zooming have no impact on loading the diagram.
Let’s have a look.
⚠ It is important to know that any other CPU load (not directly caused by our tests in progress) may have an impact on the final results. It is recommended to run all the tests in the same conditions. For these tests we have conducted 5 experiments consisting of 30x zooming in and 30x zooming out calls.
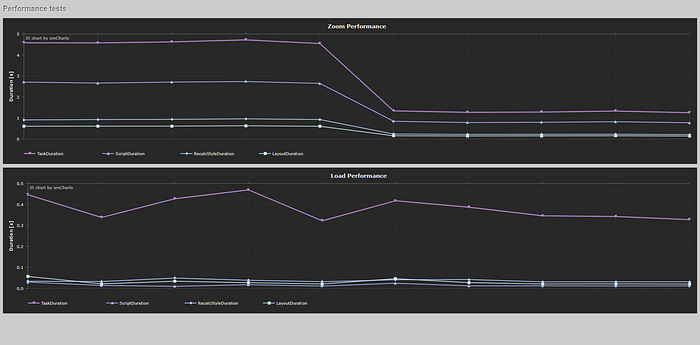
How to read the diagram? We can see similar metrics to those in flamecharts for the Script execution duration time and Style/Layout related duration time. The rule of thumb is: smaller = better. The first 5 measurements show the executions for non-optimized code. The next 5 executions are for code with applied debounce and throttle mechanisms.
Conclusion
Optimization is always a fascinating topic, even if it may seem difficult until we master the foundation. Once we have a basic understanding of what is happening with the application code, everything starts to be simple.
I hope that you have learned something new, if yes please comment, like or share! If something is unclear, feel free to pose questions in the comments. Your suggestions are welcome.
Final thoughts
Easy success won’t make you proud. If you want your users to be delighted about the tool you propose, remember the following:
- There are many ways to make your app run smoother, better, quicker.
- Profiling Tools are out there to help you.
- Performance optimization is an ongoing effort.
TIP: Measure, improve, repeat. Always give the world the best version of your work.
This article was originally published in the Bonita Community blog.